

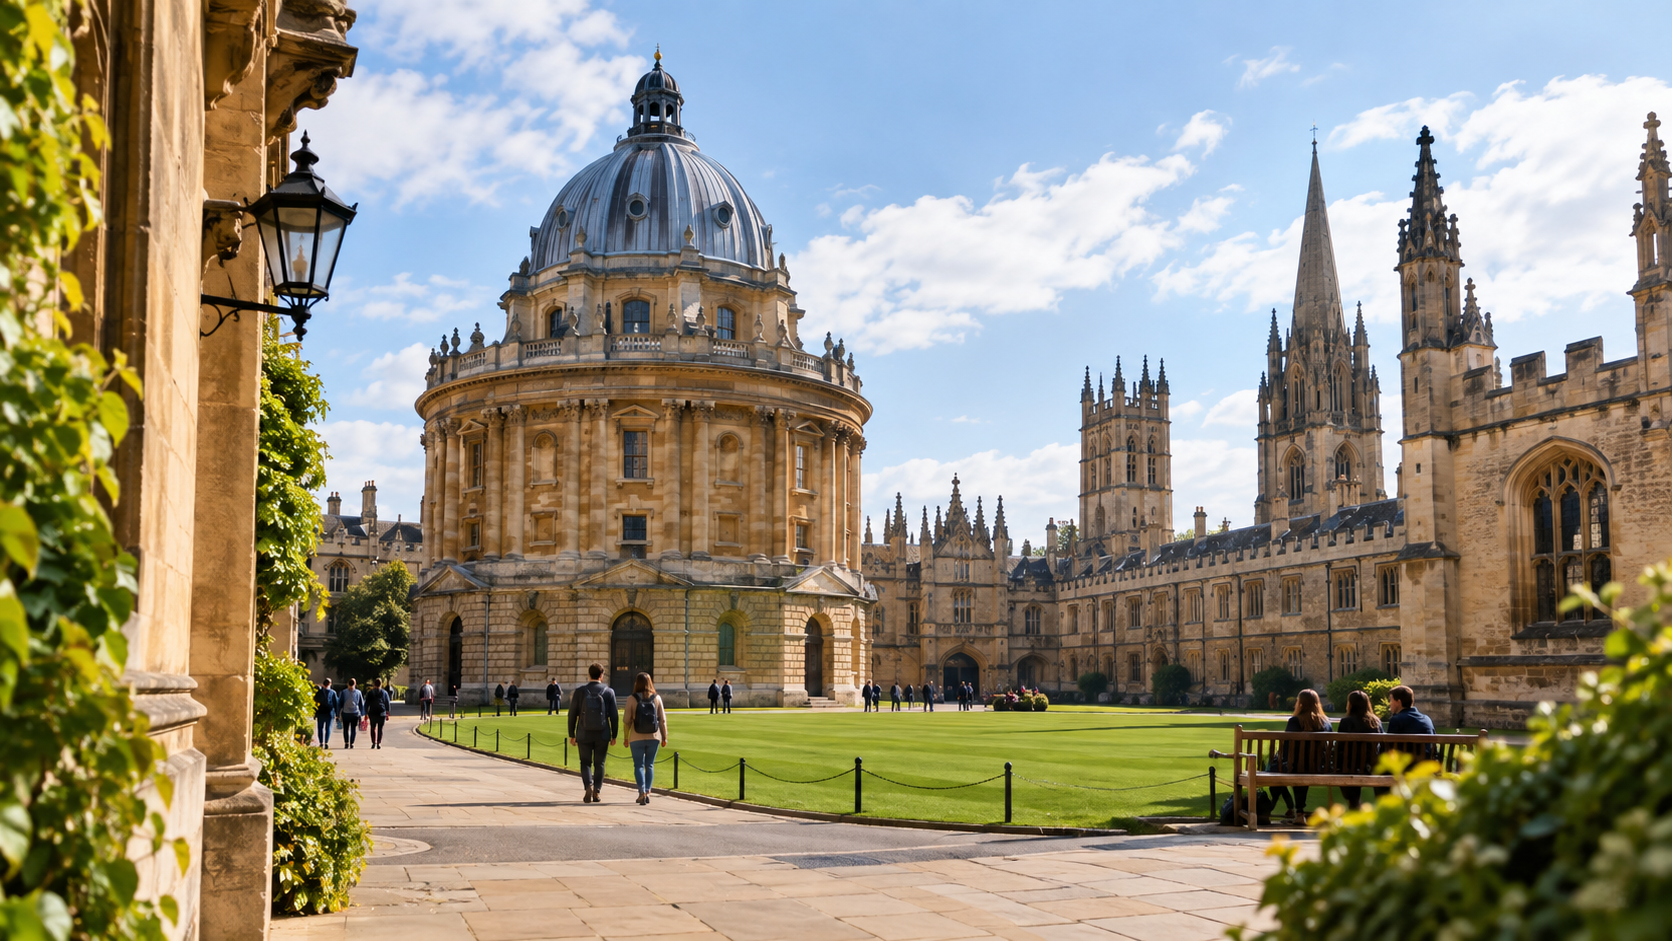
About 23,000 people apply to Oxford each year. Only around 3,300 win an undergraduate place. The latest official Oxford acceptance rate is 14.2%. It covers the 2025 cycle, when Oxford admitted 3,302 students from 23,329 applications.
(If you typed oxfords into Google hoping for shoes, this is the wrong page. This one is about the university.)
One percentage can’t describe your own chances. Your course, your country and your admissions test all shift the picture. This guide shows how. Then it lists the dates you need for 2027 entry.
Oxford Acceptance Rate at a Glance
- Undergraduate applications: 23,329.
- Students admitted: 3,302.
- Acceptance rate Oxford University: 14.2%.
- Offer rate: 16.7%.
- UK students among those admitted: 79%.
What the Acceptance Rate of Oxford University Means for 100 Applicants
Picture 100 people applying to Oxford University. About 83 get no offer. Around 17 do. Of those 17, roughly three drop away, usually because of grades or a change of plan. That leaves about 14 who take up a place.
This is why you see both 14.2% and 16.7% online. The first counts students who enrol. The second counts offers. Neither is wrong. Check which one a website uses before you compare figures.
Oxford also narrows the field before it makes any offers. Many applicants never get an interview. Test scores and submitted work decide who does.
Acceptance Rate Oxford University by Course
Your course tells you far more than the university average. These courses had some of the lowest success rates in 2025:
- Economics and Management: 5.1%.
- Computer Science: 8.0%.
- Biomedical Sciences: 8.1%.
- Physics and Philosophy: 8.6%.
- Mathematics: 9.3%.
Demand is a separate measure. Mathematics received the most applications, with 1,931. Philosophy, Politics and Economics had 1,895. Law had 1,818. Physics had 1,626. Engineering Science had 1,302.
On the toughest courses, your admissions test carries the most weight. It decides who gets an interview. Smaller humanities courses often show higher percentages. That usually means fewer applicants, not lower standards.
Acceptance Rate for Oxford: UK vs International Applicants
Where you apply from changes the numbers a lot. These are the 2025 figures:
- UK: 14,340 applicants, 2,609 admitted, 18.2%.
- EU: 1,389 applicants, 82 admitted, 5.9%.
- Non-EU: 7,600 applicants, 611 admitted, 8.0%.
- All applicants: 23,329 applicants, 3,302 admitted, 14.2%.
Forums often quote the Oxford U acceptance rate as 14.2% for everyone. If you apply from overseas, that figure overstates your odds. UK applicants do best, at almost 18%. Non-EU applicants sit at 8%.
Course choice explains part of the gap. Overseas applicants often pick courses where competition is highest. That pulls their combined rate down. Here are some countries:
- China: 2,126 applications, 198 admitted (9.3%).
- United States: 1,139 applications, 81 admitted (7.1%).
- India: 892 applications, 52 admitted (5.8%).
- Singapore: 14.1%.
- Hong Kong: 11.7%.
If you apply from abroad, look up the rate for your own course. On Economics and Management or Computer Science, it can fall in single digits. You will also need to meet English language rules such as IELTS, and pay higher tuition fees.
Oxford University Percentage Acceptance Over Five Years
In 2020, oxford university percentage acceptance rate was 15.8%. By 2025 it was 14.2%. Applications explain the drop. They reached 24,338 in 2021 and slid to 23,061 by 2024. Then they rose again to 23,329. Places stayed almost flat. So each extra applicant made the odds a little worse.
The change is gradual. No single year brought a shock. But a student applying now faces more competition than one five years ago.
Does a rate this low mean you shouldn’t apply? No. The Oxford U acceptance rate is tough. Still, over 3,300 prepared students win a place every year.
Oxford Admissions Statistics: Who Gets In?
Oxford’s Annual Admissions Statistical Report is public. It compares five years of results. It splits them by course, college, region, school type, gender, ethnicity, disability and disadvantage. Here are some findings for 2025:
- 79% of admitted undergraduates came from the UK.
- Among those UK students, 20.9% came from the most deprived areas. Oxford measures this with the Index of Multiple Deprivation.
- About one in fifteen (6.6%) had received free school meals.
- The share declaring a disability rose from 11.6% in 2021 to 19.5% in 2025.
The picture is mixed. Disability declarations rose sharply. The share from deprived areas slipped slightly, from 21.1% to 20.9%.
Does College Choice Matter? University College Oxford and Others
Oxford is a collegiate university. You apply to a single college. Options include Balliol, Christ Church, St John’s and University College Oxford. People call the last one “Univ.” It is among the oldest. If you’d rather not choose, submit an Open Application. Oxford then assigns you a college.
A campus code on your UCAS form records your preference. It doesn’t bind anyone. A different college may shortlist you or make the offer. If your first choice is full, another college may pick up your file.
Published rates differ between colleges because applicants aren’t spread evenly. Choose on subjects, location and housing. A slightly better percentage isn’t worth it.
Oxford Study: Why Tutors Admit the Way They Do
The Oxford study experience revolves around tutorials. You meet an expert tutor, usually with one or two other students. You defend your ideas out loud. You might bring an essay or a set of problems. Either way, someone will ask you to explain why.
That explains the interview. Tutors don’t hunt for the applicant who memorised the most. They want to see how you handle something new. Picture a student applying for Economics and Management. A tutor hands her a graph she hasn’t seen before. The good answers start with careful thinking about what the graph might mean. They don’t start with a recited textbook line.
Postgraduate Acceptance Rate
Graduate study draws a bigger pool. Nearly 38,000 people applied in 2023. Oxford has about 5,500 graduate places a year. That works out to roughly 14 to 15%. Your own programme may differ a lot. Funding and department size vary widely.
How Oxford Compares With Cambridge
The two sit close together. Cambridge admits about 16% of applicants. Oxford admits 14%. Cambridge’s pool is a little smaller, and its list of offers is a little longer. That explains most of the gap.
Course-level figures matter more. Some courses are harder at Cambridge. Others are harder at Oxford. You can apply to only one of the two in a single cycle. So compare the actual courses before you choose.
Oxford also looks kinder than American universities such as Harvard. But the systems differ. In the UK, you apply to a single course. Tutors judge you mainly on that subject.
Is There a 2026 Entry Acceptance Rate Yet?
Not yet. Students who applied in October 2025 started in autumn 2026. Oxford will publish their results in its next statistical report.
Demand keeps growing. For 2026 entry, UCAS counted 79,160 applications to early deadline courses. That is a record, and 7.4% up on a year earlier. These courses include medicine, dentistry, veterinary science, Oxford and Cambridge. So it isn’t an Oxford-only figure. Still, expect 2027 to be just as competitive.
Oxford 2027 Entry: Dates That Matter
- UCAS deadline: 15 October 2026 at 6pm UK time. Oxford accepts no late applications.
- Admissions tests: sit the October 2026 test. Booking is not automatic. It closes in late September. Check the UAT-UK website today.
- Foundation year: Astrophoria Foundation Year applicants have a January deadline. They can sit the test in October 2026 or January 2027.
- Interviews: online for 2027 entry, usually in December.
- Decisions: you’ll find out on 12 January 2027.
The New Admissions Tests
Oxford changed its tests in 2026. It now uses the ESAT, TARA and TMUA. They are computer-based. UAT-UK runs them. That group is a collaboration between Imperial College and the University of Cambridge. You sit them at a Pearson test centre. Medicine still uses the UCAT. Law applicants take the LNAT.
The old TSA, MAT and PAT no longer apply. Many practice books and websites still teach them. So check that your preparation matches the current tests. Your course page names the one you need.
What to Do in the Next Few Weeks
Book your test first. Missing that window ends your application before it starts. People forget it more than any other deadline.
Next, submit your UCAS form a week early. School references often arrive late. Websites crash on deadline day. While you wait, practise for your test with timed papers. Casual reading isn’t enough. Also check your course page for the A-level or IB grades you need.
Then look up the success rate for your exact course. It tells you how much your test score will count. If it’s under 10%, treat your preparation as a serious project.
The Short Version
The Oxford University acceptance rate of 14.2% makes Oxford competitive but achievable. Your course, country and preparation matter far more than that one figure. For 2027 entry, the biggest risks are missing the test booking window and the 15 October deadline. Sort those out first.
Last updated: September 2026
Frequently Asked Questions
What is the Oxford acceptance rate?
The latest official figure is 14.2% for 2025 entry. Oxford admitted 3,302 students from 23,329 applications.
What is the Oxford acceptance rate for 2026?
Oxford hasn’t published it yet. Figures for students who applied in autumn 2025 will appear in the next admissions statistical report.
Does the University of Oxford acceptance rate change every year?
A little. It moved from 15.8% in 2020 to 14.2% in 2025. Application numbers drove most of that change.
What is the Oxford U acceptance rate for international students?
In 2025, Non-EU applicants had an 8.0% acceptance rate. EU applicants had 5.9%. UK applicants had 18.2%.
Is the acceptance rate for Oxford lower than Cambridge?
Slightly. Cambridge admits around 16% of applicants. Oxford admits 14%.
When is the Oxford application deadline for 2027 entry?
It’s 15 October 2026 at 6pm UK time.
Where can I find official Oxford admissions statistics?
Oxford publishes them online each year in its Annual Admissions Statistical Report.